We built one imaging network a payer ranking and told them to protect their best-paying slots. Then the protected slots lost more bookings than the ones we had deprioritized — 15% against 10%.
Not because the ranking was wrong. Because we had ranked on price, and a slot is only worth what shows up.
Key Takeaway: Across fourteen centers, revenue per completed slot was $421. Revenue per available slot — what we call revenue per available magnet-hour — was $372. That gap is your real capacity utilization problem, and it is invisible on a standard P&L. Two instructions your own reports give you ("fill the schedule" and "refuse the bad payers") are opposite, and which one applies depends entirely on whether your hour is scarce. At nine of the fourteen centers, the payer-mix fix earns nothing at all. At one center running 88% full, it still earns nothing — because its constraint was never the magnet.
Every imaging P&L measures the scan. Almost none measures the hour. The moment you measure the hour, a number of things you believed about your own book stop being true.
What an imaging slot is actually worth
An imaging center's scarcest asset is not its scanner. It is a scanner-hour, and a scanner-hour is perishable in the strictest sense — Tuesday at 11:00 cannot be sold on Wednesday. It either produced revenue or it did not, and at midnight the inventory is destroyed.
That makes an imaging center structurally identical to an airline. Airlines learned this in the 1970s and built an entire discipline around it.
The unit airlines use is revenue per available seat mile. Not revenue per ticket sold — revenue per seat they could have sold. The imaging equivalent is revenue per available magnet-hour: total collections divided by every hour the machine was staffed and open, not just the hours that produced a study.
Here is what that looked like across the fourteen-center network:
| Measure | Value | What it tells you |
|---|---|---|
| Revenue per completed slot | $421 | How well you convert a scan into cash |
| Revenue per available slot | $372 | How well you convert capacity into cash |
| Implied utilization | 88.4% | The gap between the two |
The first number is the one every practice tracks. The second — the magnet-hour number — is the one that pays the rent. A center can improve the first while destroying the second — by becoming more selective, running fewer studies at higher yield, and leaving the machine idle.
And the formula for what any single booking is worth is not the contracted rate. It is:
Slot value = contracted rate × the probability the patient shows up
Almost nobody computes the second term. We did not either, at first. That is how we got the ranking wrong.
Your two best instincts contradict each other
If you have had a decent financial analysis done on your practice, you have probably been told both of these things.
"You do not have a profit problem. You have a volume problem." Your fixed costs are enormous and largely indifferent to how many patients walk through the door. The fastest path to profitability is more studies, not fewer costs. We have written that article ourselves, and it is correct.
"Some of your payers lose money on every single procedure." Grade them A through F, find the F's, and stop scheduling them. We have written that one too, and it is also correct.
Now put them side by side. One says fill the schedule with whoever will come. The other says refuse a specific set of patients. They are opposite instructions, and nothing in a standard monthly financial statement tells you which one applies to you.
The reconciling variable is whether the hour is scarce.
On an empty magnet, your worst-paying payer is pure contribution. You cannot lose money on an hour that would otherwise have billed nothing — the staff is there, the lease is there, the scanner is warm. Any payment above the variable cost of that study is money you would not otherwise have had.
On a full magnet, that same booking is not free at all. It occupies an hour that a better-paying case wanted, and the cost of accepting it is the case you turned away. Economists call that the opportunity cost. Airlines call it the bid price.
Same payer. Same contracted rate. Opposite correct answer. The only thing that changed is occupancy.
This is not a new idea, and it is not ours. In 1972, an analyst at British Overseas Airways Corporation named Ken Littlewood wrote down the rule.
It goes like this: accept the discounted booking as long as its revenue exceeds the full fare multiplied by the probability of selling that seat at full fare later. Everything since — protection levels, nested booking limits, the booking-limit optimization literature from MIT's Operations Research Center — refines that one sentence.
Applied to imaging, it reads: accept the booking if it pays more than the slot is worth held. At a center with room, that rule says accept everything. At a full one, it says defer. One rule, opposite outputs, and the arithmetic tells you which.
What fourteen imaging centers actually showed
We ran the numbers both ways across a fourteen-center network — every completed study, every payer, every hour of the day, every location.
The first thing that fell out was that the center mattered far more than the hour. The spread in slot value across centers was 1.80×. Across hours of the day, it was 1.12×. If you have finite effort — and you do — it belongs at the location level, not the time-of-day level.
The second was about who actually makes this decision. This network employed 66 people in scheduling and the call center — 22.8% of the entire wage bill, and more headcount than the 54 people operating the scanners. Sixty-six people were choosing, every morning, which booking went into which hour.
None of them had a report. None of them had a dollar figure attached to the choice. They were making the highest-leverage financial decision in the business on instinct, and doing better than you would expect, because instinct is not nothing. But instinct does not scale and it does not survive turnover.
The payers you protect are the ones who do not show up
Then we measured attendance, and the ranking we had built inverted.
We had sorted the book into priority bands by what each payer pays. Band A was the protected tier — the best rates, the cases worth holding capacity for. Band D was the tier we had recommended releasing later.
- Band A — the protected tier — lost 15.0% of its bookings.
- Band D — the deprioritized tier — lost 10.2%.
The payers we had told them to protect were the ones least likely to arrive. Sorted by attendance, the book looked nothing like it did sorted by price:
| Payer rail | Show rate |
|---|---|
| Government | 93.6% |
| Commercial carrier | 90.2% |
| Attorney-referred | 81.2% |
| Brokered networks | 77.4% |
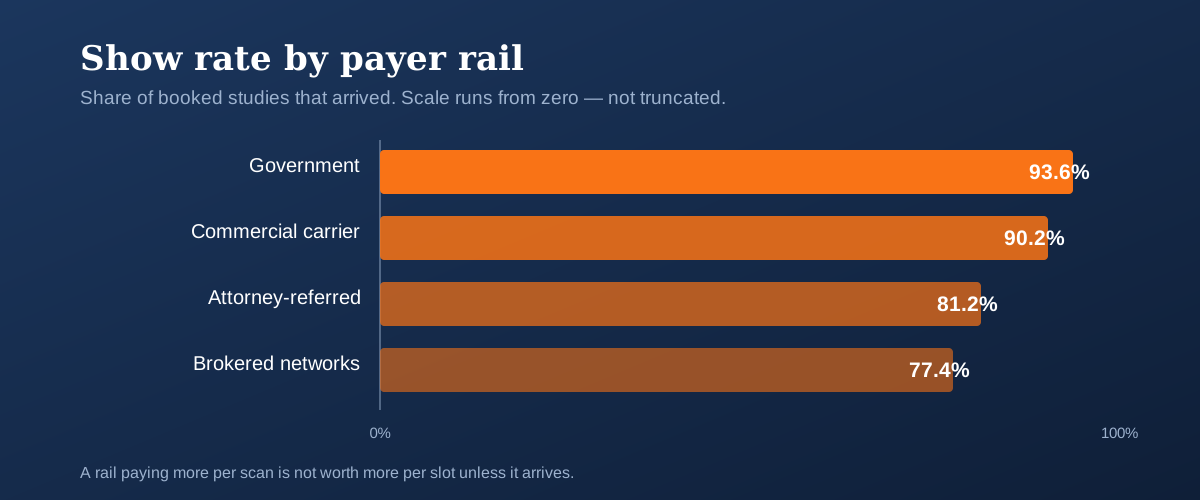
Read those two lists together and the arithmetic changes. A rail paying $403 a scan that arrives 81% of the time returns about $327 in expectation. A rail paying $163 that arrives 94% of the time returns about $153. The better payer is still the better payer — but the gap is narrower than the rate card suggests, and in specific cells it closes almost entirely.
It gets worse through the day. Attendance in this network declined steadily from morning to evening across every rail. For the attorney-referred rail, day-of loss ran 13.6% at 7am and 23.5% at 6pm. So a 6pm booking from a high-rate rail is worth materially less than the same booking at 7am — a difference that never appears anywhere in a fee schedule.
Remember the 1.12× hour spread from the previous section? That was measured on studies that actually happened. Once attendance enters the calculation, the hour carries a second, independent gradient stacked on top of it. The hour matters more than our own first pass said it did.
Missed appointments in imaging are well documented, and the published rates vary wildly. A 2016 study in BMC Health Services Research found a combined no-show-and-reschedule rate of 34.8% among 904 scheduled outpatient MRI appointments. Large multi-year academic series report figures in the low single digits.
Both are correct. They count different denominators — all scheduled appointments versus appointments that survived to the day. Which is precisely the trap: if you do not know which denominator your own no-show number uses, you cannot compare it to anything, including your own number from last year.
Where capacity utilization rules do not apply
Here is the part that separates this from every "optimize your payer mix" article you have read.
It does not apply everywhere. At nine of the fourteen centers, doing this earns nothing.
A capacity rule only creates value where the magnet-hour is genuinely scarce. Deferring a lower-value booking at a center with empty hours does not upgrade that hour — it moves the same study around the calendar and leaves the magnet just as idle. You have added scheduling friction and bought nothing.
Of the fourteen:
- Four had enough of their book in the lower bands, and enough genuine congestion, to justify the full approach.
- Three warranted a light version.
- Five should not run it at all.
- Two had effectively no exposure — their books were already almost entirely high-value.
And one center was the most instructive of all. It ran at 88% full — by any dashboard, the most constrained site in the network. It should not run this either.
Its problem was not that the wrong patients were filling the hours. It was that not enough patients of any kind were being referred to it. The constraint was upstream, in the referral base, and applying a capacity rule there would have emptied the magnet rather than upgraded it.
A high utilization number does not tell you your constraint is capacity. You have to test which resource is actually binding before you manage it.
If you run more than one location, could you say today which of them is genuinely constrained? That is the question worth answering first. It is also worth a conversation before you change anything about how the schedule gets built.
What we got wrong
We ran the airline playbook against real data and the data killed part of it. This is worth saying plainly, because a method that has never been falsified has never been tested.
We assumed midday was the peak worth protecting. It is the trough. Lower-value bookings concentrated at noon — 38% of midday bookings against roughly 25% at the shoulders.
"Protect the midday slots for premium work" was airline intuition applied by analogy, not a measurement. We removed it from the recommendation.
We assumed overbooking would carry part of the solution. It does not. Leadership rejected it outright on clinical grounds — exam quality suffers, and technologist attrition follows double-booking.
That is the correct call, and it means the model has to work through allocation alone. Airlines absorb no-shows by selling the seat twice. An imaging center that will not do that has exactly one lever left: raise the show rate.
And we ranked on price before measuring attendance, which is the error this whole article is built around.
How to measure imaging center capacity utilization yourself
You do not need a consultant to start this. You need four queries against data you already have.
- Divide total collections by staffed scanner-hours, per location, per month. Not per study. That single number is your revenue per available magnet-hour, and it is probably the most important figure in your business that nobody has ever handed you.
- Compute your show rate by payer rail and by hour of day. Then multiply it by your contracted rate. That product — not the rate — is what a booking is worth.
- Test which centers are actually constrained. Look for locations that are genuinely turning demand away, not just locations with a high utilization percentage. They are not the same thing, and confusing them is expensive.
- Check your denominator. Is your "no-show rate" measured against everything scheduled, or against everything that survived to the day? Advance cancellations usually vanish from these reports entirely, which makes the number look better and comparisons meaningless.
If those four numbers disagree with your instinct about your own business, that disagreement is the finding.
Most accounting firms would look at an imaging group's P&L, see a healthy margin per study, and move on. But margin per study is the number that improves when you get smaller.
Reading the same business as an operator means asking what the machine did with the other eleven hours — and then asking who decided what went into them. Here the answer was 66 people with no report. That is not a criticism of those 66 people; it is a measurement gap nobody had ever been asked to close.
This is what happens when accounting stops describing the past and starts pricing the present.
The Monday morning after this analysis landed, the leadership team made a decision they had been circling for months. They picked the specific centers where capacity was genuinely binding, left the other nine alone, and gave the scheduling desk something it had never had: a number attached to a choice it was already making sixty-six people deep, every single morning. Nobody had to be told to work harder. The team that had been guessing well was handed the arithmetic to guess less. That is the shift — not from bad decisions to good ones, but from instinct that cannot be taught to a rule that can be handed to the next person hired.
Frequently asked questions
What is revenue per available magnet-hour? It is total collections divided by every hour your scanner was staffed and open — including the hours that produced no study. It is the imaging equivalent of an airline's revenue per available seat mile. It differs from revenue per completed scan, which only counts the hours that worked.
Should I stop scheduling my lowest-paying payers? Only if that hour is genuinely scarce. On a center with open capacity, a low-paying study still contributes above its variable cost, and refusing it leaves you with an idle machine and the same fixed costs. On a full center, the same booking displaces a better one. Measure occupancy per location before you touch the schedule.
My centers run at 85–90% utilization. Is capacity my constraint? Not necessarily. One center in this analysis ran at 88% and its binding constraint was referral volume, not scanner time. High utilization with a starved referral base looks identical on a dashboard to high utilization with excess demand, and the correct action is opposite in each case.
Why does the show rate matter more than the contracted rate? It does not matter more — it matters as well, and it is almost never measured. A booking is worth the rate multiplied by the probability the patient arrives. A rail paying $403 that shows 81% of the time is worth roughly $327 per scan in expectation; ignoring the second term overstates your best payers and understates your most reliable ones.
Can I apply this if I only have one imaging center? Yes, and it is simpler. The center-versus-hour question disappears and you are left with one book, one capacity curve, and one set of show rates. The same four measurements — collections per staffed hour, show rate by rail and hour, a genuine test of what is binding, and a check on your denominator — work identically on a single location.
Want to know what your slots are actually worth? We build revenue-per-available-hour analysis from data you already have in your practice management system — no new software, no new data collection. Start a conversation and we will tell you which of your locations are genuinely constrained and which ones are not. You can also read how accounting becomes an ROI center rather than a compliance cost, or see the companion analysis on per-modality profitability.
Capacity and payer mix decide the same dollar. A filled slot on a slow-paying rail is not the same asset as a filled slot on a fast one - which is why the Radiology Intelligence Pack reads net revenue per scan and days to cash off the same volume, across four centers. Fictional group, synthetic figures. In an engagement we run it on yours.
Disclaimer: This article is for informational purposes only and does not constitute tax, legal, or financial advice. Tax situations vary — consult a qualified tax professional for advice specific to your circumstances. Practice examples are anonymized composites based on real client data; identifying details have been changed. Scheduling and payer-access policies may be subject to contractual and regulatory obligations; consult qualified healthcare counsel before implementing changes to patient access or appointment availability.